The perfSONAR toolkit is an open source network measurement package designed to provide multi-domain network monitoring and establish end-to-end network usage expectations. It has proven popular in research and education networks, particularly for communities who move large volumes of data over significant distances. For example, sites taking part in CERN’s Worldwide Large Hadron Collider Computing Grid (WLCG) host over 200 perfSONAR servers between them spread over 40 countries.
You usually deploy a perfSONAR server alongside a filestore you use for data transfers to other sites so you can test the network characteristics – throughput, latency, loss and path – over time to perfSONAR servers at those sites, in so doing building up a picture of how your network is performing over time, and what sort of capacity and data rates might be available when you’re moving data for real.
While the latency, loss and path tests run continuously, the iperf-based throughput tests by default run roughly every 6 hours and are scheduled by the pscheduler component to avoid clashes with other throughput tests. The iperf results will be indicative of what an application could have achieved.
You can use perfSONAR pro-actively to explore how your tests are performing and test various network tuning parameters or reactively to explore historical network characteristics when a performance problem is observed by your users. Perhaps a drop in throughput is caused by increased packet loss or by an asymmetric routing problem. It’s so much easier to debug issues when you have a history of measurements rather than having to run ping, traceroute or iperf on the spot without any past context.
perfSONAR has evolved over time and this year is turning 20 years old. With each new release various components of the toolkit have been improved. In April 2023 the major version 5.0 release brought a new Opensearch backend. Then in June this year version 5.1 was released with a new Grafana-based front end. Out went the ‘classic’ toolkit and MaDDash views and in came some very slick new visualisations.
Our network performance team at Jisc maintains a virtualisation platform that hosts, amongst other things, a perfSONAR archive function and perfSONAR configuration and Grafana templates. If you run a perfSONAR server you can talk to us and we can arrange to archive your results and let you then use our Grafana tools to view them, which can be of particular value if you take part in a perfSONAR ‘mesh’ where a community of servers all test against each other.
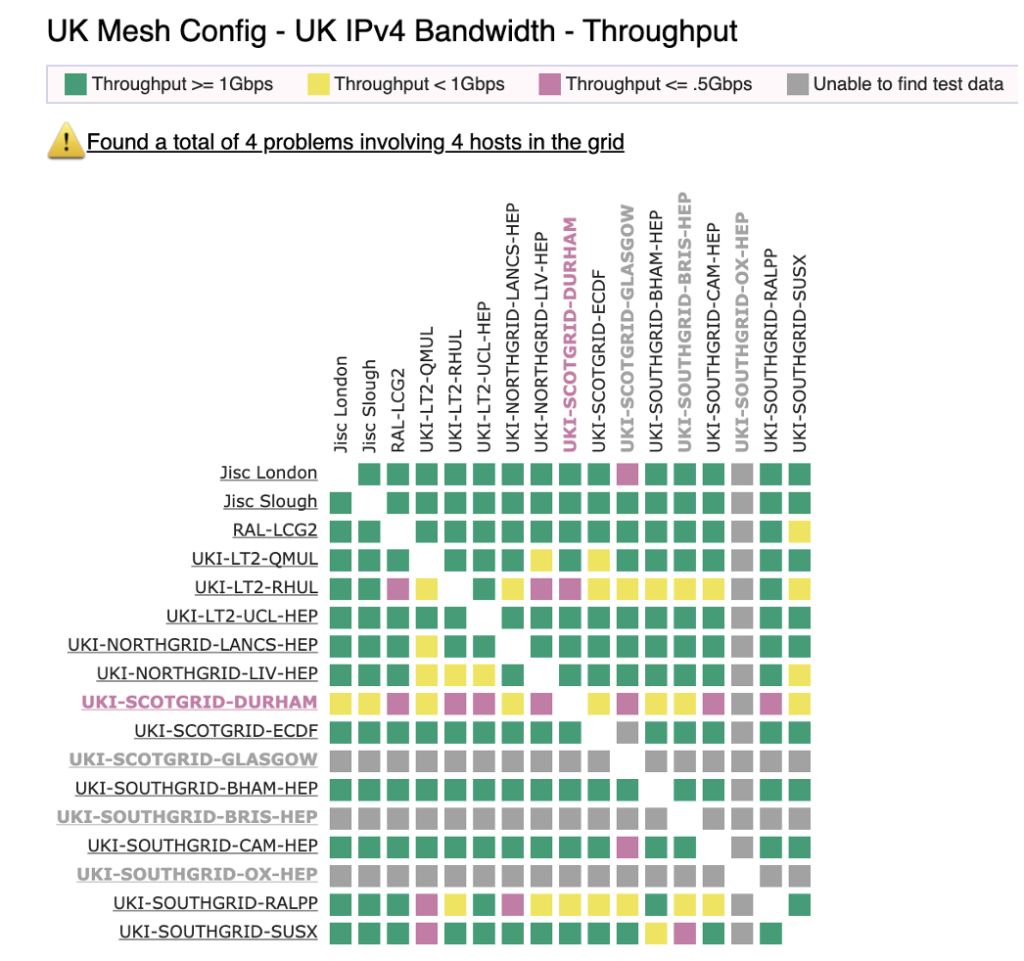
If you used perfSONAR prior to this summer you would be familiar with the old style mesh views, where colours in each mesh provide an at-a-glance summary of recent behaviour, for example with the UK GridPP community mesh for IPv4 throughput below:
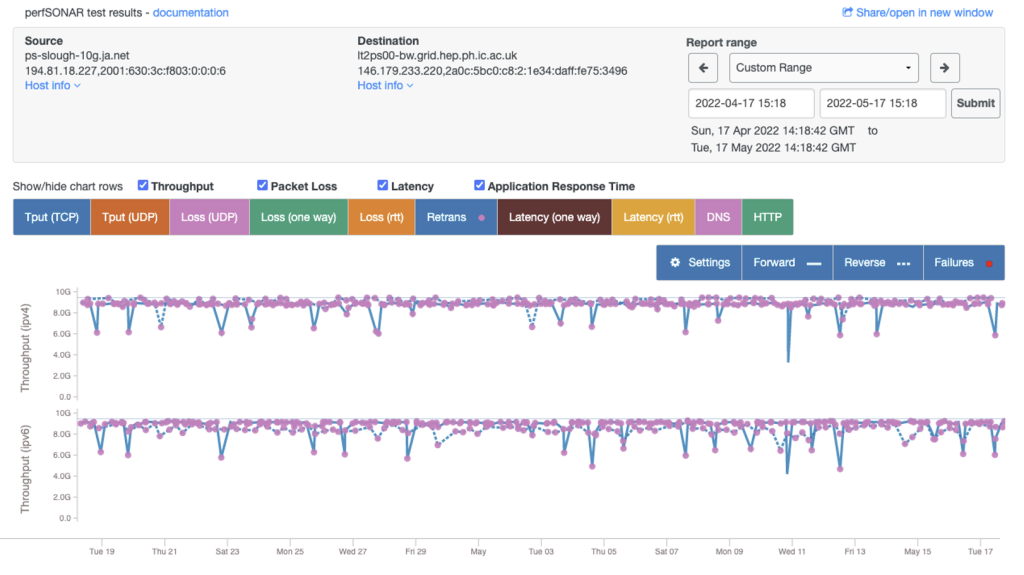
If you then drill down into a specific square you can see results over time, in the case below for measurement between our 10Gbit/s server at Slough and a server at Imperial College:
The new Grafana views are fundamentally of the same data for the mesh and server-to-server views, but the flexibility of Grafana allows new types of information to also be presented in creative ways.
Our network performance team is currently operating a UK “test” mesh that sites who run perfSONAR can join. This is giving those sites a feel for what the new visualisations look like, but also are helping us at Jisc develop how the data is presented. We have regular meetings with the developers to assist with this, and indeed take part in the GÉANT project within the perfSONAR activity there. Once we’ve got the views into a shape that everyone is happy with we’ll launch new, more formal meshes including a new GridPP mesh.
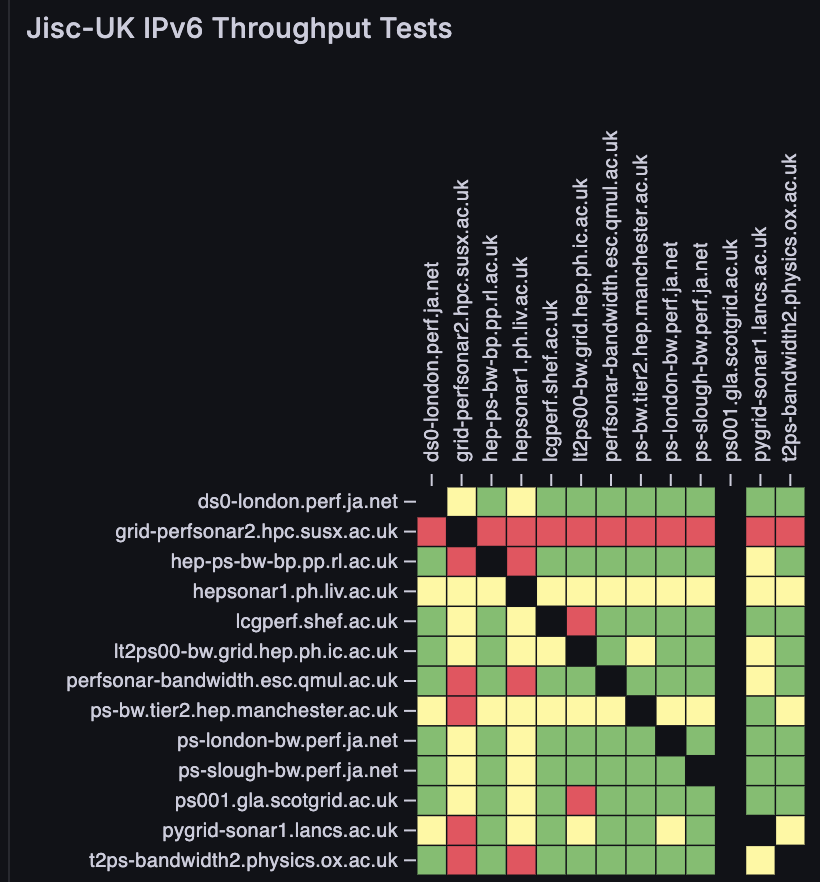
You can see the test mesh here. The IPv6 throughput mesh view looks like this:
and you can then drill down as before into specific results over time. For example, here is a 7-day view of our 100G London server and QMUL:
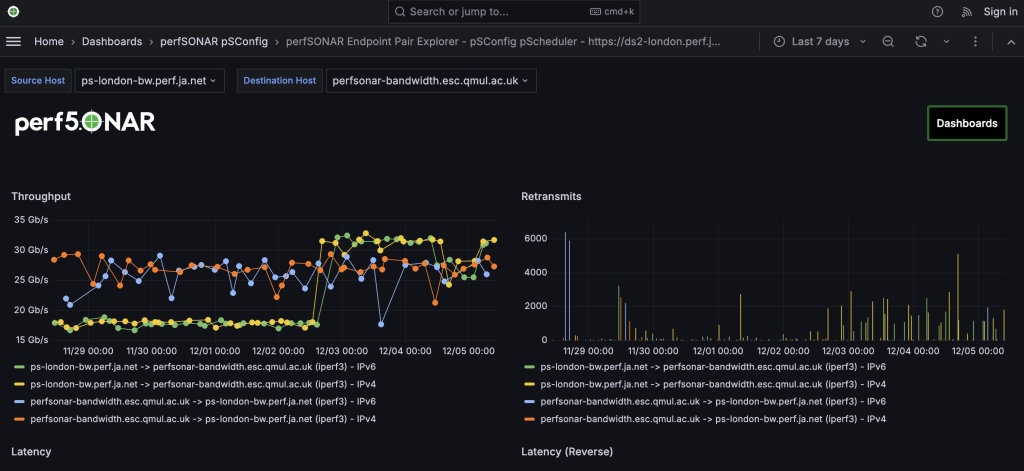
The above plot is interesting because there was a change made to the host tuning which affected the throughput from ps-london to QMUL. You can see IPv4 and IPv6 plotted, in both directions, and a side chart of retransmissions. As an aside, there’s very good guidance on Linux host tuning at the ESnet Fasterdata site.
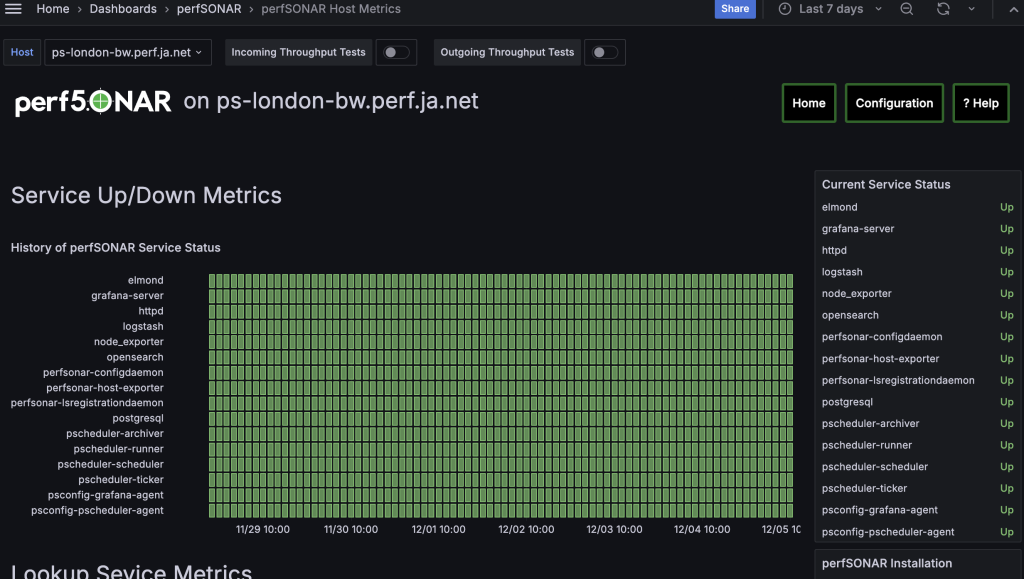
Another benefit of the new Grafana support is the provision of host stats. For example, you can see the stats for our ps-london server here, which includes the history of perfSONAR sub-service status, and data such as CPU and network load over the past 7 days:
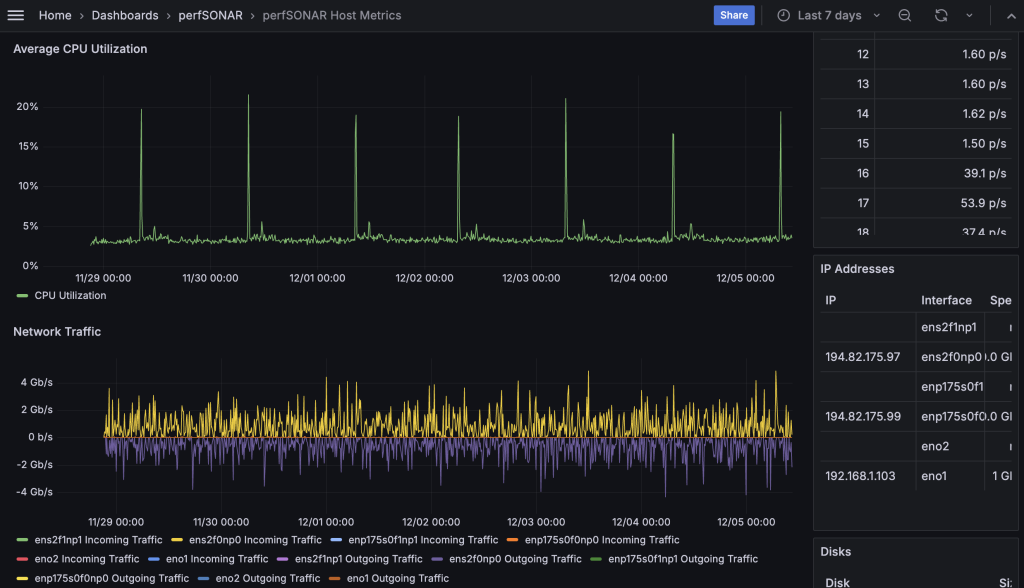
At the foot of the page you can also see the network tuning, and supported congestion control algorithms, which is very useful when running remote or third party tests. You can also see stats for other servers in the same mesh by selecting the host interface name in the top left selection box. Note servers will test for throughput and latency/loss on different interfaces.
If you’re interested in joining the test mesh or want any assistance with setting up perfSONAR please feel free to contact our team at netperf@jisc.ac.uk. Once you have perfSONAR installed you just need to run one command to point your server at our mesh configuration file after which you’ll be included and – hopefully – see results.
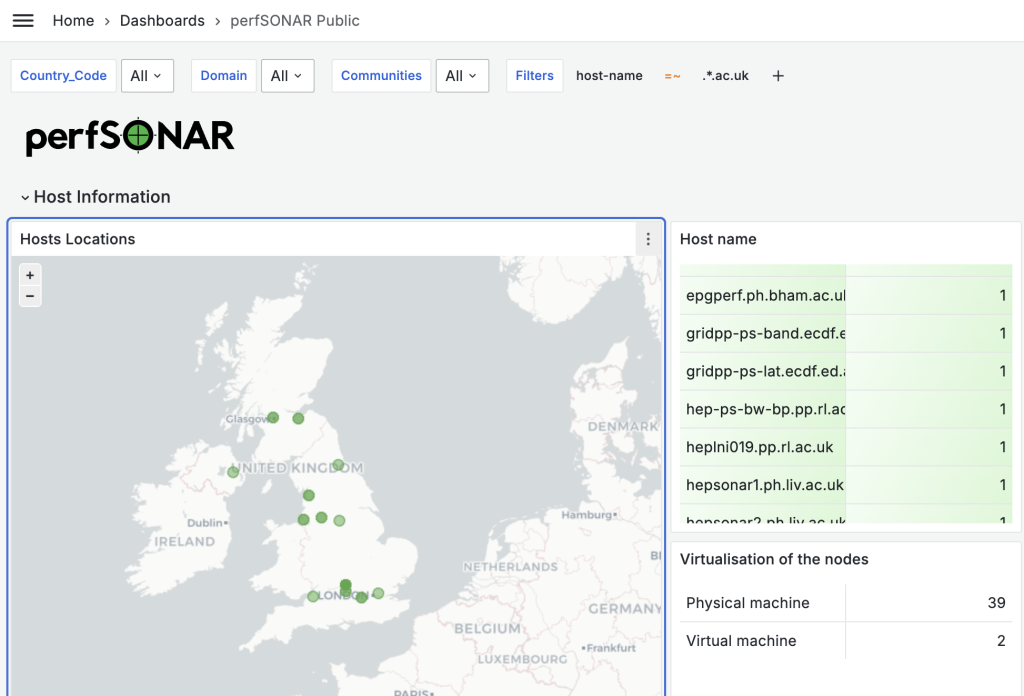
If you want to find a perfSONAR server to test against you can visit the new perfSONAR stats site and, if you want to find other servers on Janet set the filter to host-name, operator to =~ and match against .*.ac.uk as shown below:
You can choose when installing whether you want to be added to the global directory; not all sites do.
Hopefully this article has piqued your interest in perfSONAR. If so, we look forward to seeing more servers up and running and maybe hearing from you.
Finally, if you’re interested in further information about our two Janet perfSONAR servers (10G at Slough and 100G in London) you can check our network performance tools page.
