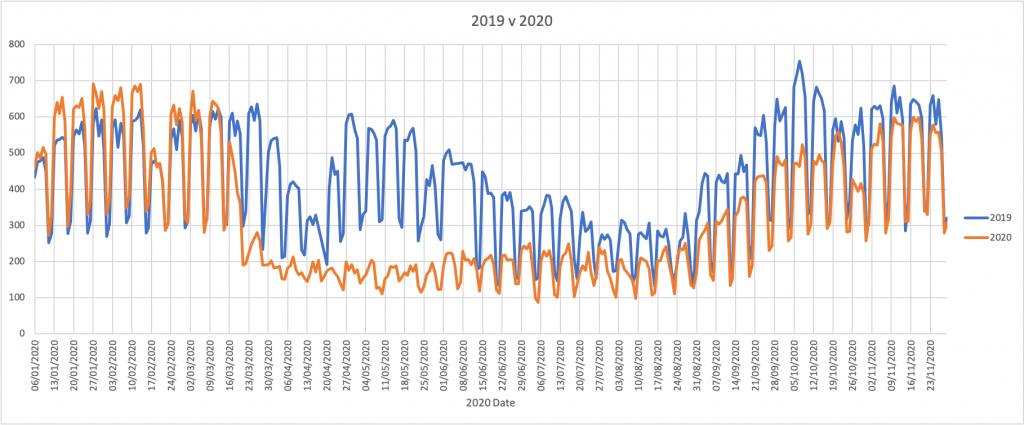
As we approach the end of the calendar year, and are in what would traditionally be a busy period of the year for traffic on the network (after the school half-term and before University autumn term ends), I thought it would be worth doing a follow-up to the blog posts (first, second) earlier in the pandemic about traffic levels on the Janet network. As usual, the focus here is on the external edge of the network where Janet connects to transit, GEANT and other service providers — including cloud providers.
Those that joined the recent Tech 2 Tech on ‘futures’ may have had a little sneak preview of what this is going to say.
The first part of this graph is the same as I’ve used in earlier blog posts, and as you can see the traffic levels this year started off, as you might expect, higher than the same time last year. Then the pandemic hit, traffic on Janet dropped as we started to work and study from home, and it stayed that way throughout the summer.
As the autumn term started then campuses filled again and traffic started to rise. Over the summer we had received quite a few queries about our capacity to cloud providers, especially providers of videoconferencing facilities such as Microsoft Teams and Zoom. Janet’s members were understandably concerned that if a lot of students would be on-campus, but learning via video, it could lead to congestion not only on Janet’s external border, but also across the network and at the access links for the sites.
It was a difficult worry to quantify. Estimations of nn,000 students at campus each consuming a 2Mbps video stream may have taxed many connections (not to mention the wireless infrastructure on campus), but we’ve not seen any evidence of it happening.
Not only did that deluge of video streams not swamp the network, the traffic levels on the Janet border are still lower than they were this time last year, and we have plenty of headroom on our peerings with, for example, Microsoft (Zoom doesn’t have a peering edge in the UK and uses a variety of cloud providers such as Oracle and AWS that means it is difficult to get a picture of its traffic levels).
You may remember that in earlier posts and presentations I mentioned that our traffic with the major domestic broadband providers jumped significantly at the same time that traffic overall dropped. The interesting thing is that those traffic levels have, other than a dip over summer, increased even more since then, so there is certainly a lot more traffic being shipped from Janet to BT and Virgin Media than there was before we started teaching, learning and working from home — or rented student accommodation.
A colleague tells me his daughter doesn’t watch her lectures live, but at a time of her convenience when she can pause them and make notes (or, he suggested more cynically, when it wasn’t quite so early in the day). I suspect that the traffic pattern is a single copy of a video stream being uploaded to a cloud provider, then the streaming happens from the cloud provider to a split of accommodation either connected to Janet, or connected to the broadband providers.
I’m interested in what you’ve seen as campus network managers — drop me a line if you’ve got my email address (if you look at the format of Jisc email addresses it isn’t hard to guess), or send me a message on Twitter.
What will 2021 hold? We’ve got plans to upgrade the backbone with another 200G on top of the 600G trunks that are already there (once we’ve done some Ciena software upgrades), and we’ve bought a couple of extra linecards for our peering edge as more connections move from multiples of 10G to multiples of 100G (and a couple of upgrades to content delivery networks are in the pipeline).


One reply on “Another update on Janet’s traffic levels as the autumn term ends.”
Rob
I was fascinated to read this blog post to see just how Janet was coping with this dramatic change in the way people work (and learn). Seems as if the Janet design works well and with ability to add capacity you look well set.