Traditionally network monitoring of properties such as traffic levels through an interface has been done by using SNMP-based polling of network devices. With such polling typically performed every five minutes the resulting plots will produce 5-minute data samples, so the traffic level shown over time, and the maximum rates seen, will be an average for that five minute period.
More recently, another option has become available, in the form of streaming telemetry. This new approach allows devices to push monitoring data to a collector, in real-time. This means the collector can receive much more fine-grained reports of traffic levels and other device properties, which can be very helpful when looking to troubleshoot or diagnose specific network behaviour where there are changes happening over a few seconds.
While it is possible to increase the frequency of SNMP polling, the five minute sampling that is commonly used has become something of a ‘standard’ over time, in part driven by the number of devices a collector may need to poll, and the time it takes to collect the data from each device.
Configuration of streaming on Juniper devices is described in a recent white paper on zero footprint monitoring from the GÉANT GN4-3 project I’ve been working on, where examples are given using Telegraf as a collector. The gRPC-based streaming telemetry is gaining popularity due to its open format, using key-value pairs.
The GN4-3 project includes evaluation and development of a variety of network services, including network monitoring and performance measurement. We have recently been testing performance from Europe to Brazil over the new 100G BELLA link which went live earlier this year. We’ve been working with our NREN partners in the Netherlands (SURF) and Brazil (RNP) to set up and run the tests. We’re particularly grateful to SURF for providing 100G capable test endpoints.
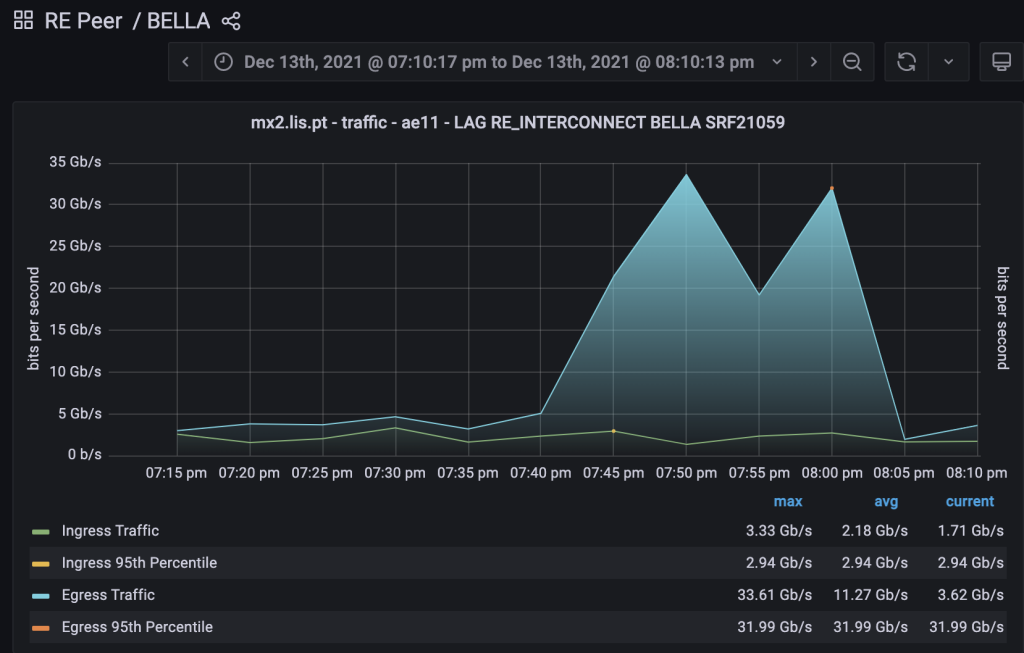
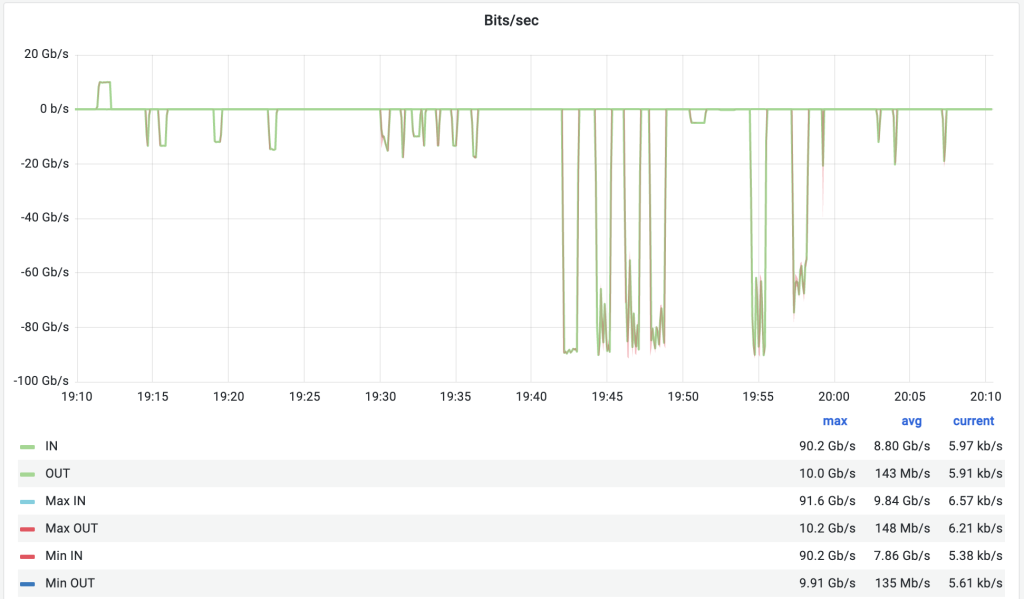
After some tweaking of system configuration and routing, our performance tests have achieved over 90Gbps, memory to memory, between SURF and Forteleza, in the presence of background traffic. An interesting aspect of the testing lies in how short-lived tests appear when viewed in different monitoring platforms. The new GÉANT monitoring system, BRIAN (Backbone Router Interface ANalytics), presents traffic levels seen over BELLA via classic 5-minute SNMP samples. Thus a short test might only show as, say, 20Gbps if it doesn’t occupy the full sample window. In contrast, the streaming telemetry visualisation that SURF is exploring shows much finer-grained traffic reporting, and can present other useful properties in an easy-to-digest view, such as egress buffer occupancy, or egress buffer drops.
An example of the BRIAN view (which includes all traffic over the BELLA link) and SURF streaming telemetry view (from within SURFnet) of the same one hour period in which short tests were carried out can be seen below.
Streaming telemetry was tested within the BRIAN framework, but GÉANT chose to launch the service using the traditional SNMP approach. As the Juniper implementation matures, it’s likely that this will be revisited. Having a more real-time view of traffic levels clearly has benefits for inspecting the fine details of network behaviour.
The extra detail is not for free however; more data produced means more data to be stored, and appropriately curated. There may also be additional load on the router or devices pushing the data. Issues such as these will be better understood as more experience is gained from deployment.
We’re naturally interested in this technology at Jisc, and will be looking at where we might make use of it in the future. We’d be very interested to hear from members who share that interest, or who might be using streaming telemetry already. What do you think? You can email our network performance team at netperf@jisc.ac.uk. It might make a nice topic for Networkshop 50 in June, the call for speakers for which is open, or for a future Tech2Tech session.