(with apologies to Gabriel García Márquez.)
In a previous blog , I suggested that a significant amount of the remaining roaming activity might relate to NHS usage. Some itches need to be scratched, so I have dug a little further into the eduroam stats with the help of my colleagues Stefan and Ed. As a reminder, we see the situation more clearly with eduroam, where all roaming activity passes through the Jisc core, than we do with govroam, where regional activity stays local. This analysis looks at eduroam only, although I’m aware that there is comparable use of govroam by the NHS also.
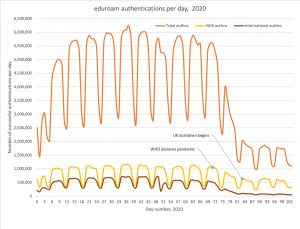
Let’s start with just the number of successful authentications on eduroam for each day of the year so far. You’ll recognise the typical pattern of a service that is heavily used during the working week and is much quieter at the weekends. The graphs for total authentications remain pretty consistent week-on-week for the business as usual period across all 3 communities we track here (total, NHS and international). Following the pandemic being officially confirmed and the subsequent implementation of social isolation in the UK, both total authentications and international roaming traffic drop dramatically. The international traffic represents not only international ‘commuting’ for education sector business, but also numbers of international students studying in the UK, and their UK equivalents studying overseas. Many of these students returned to their home countries when a lockdown started to look likely. NHS-related activity, the yellow graph, also reduces by about 40%, but this reduction is much less than the other categories.
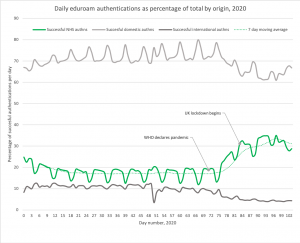
We can examine the relative eduroam usage by the NHS compared with the other categories against this background of overall reduction by considering service usage as a proportion of the total each day. Here, the NHS graph (highlighted in green) stands out as almost doubling across the lockdown period in terms of its contribution to the total authentication traffic on the service; by Easter, over a third of the traffic on eduroam was supporting NHS productivity.
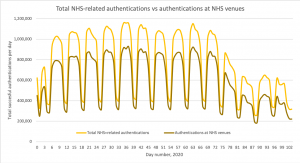
To complete the story, let’s look in more detail at the NHS aspects of eduroam’s traffic. Again considering authentications first, we see the same overall reduction in use trend noted above, and now have the added detail that 80% of the remaining traffic is associated with people logging on to eduroam physically at NHS venues, mostly hospital trusts. The remaining ~20% represent staff affiliated with NHS home organisations accessing eduroam at non-NHS locations, from universities to transport hubs and other public venues.
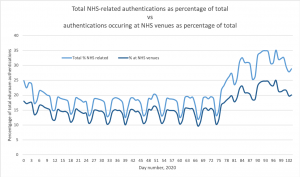
Finally let’s again examine these figures in proportion to the total service traffic. A similar picture emerges, although arguably the amount of traffic from NHS logins at non-eduroam venues (the ‘gap’ between the two curves) is slightly larger since the implementation of the isolation protocol. This may reflect the continuing commuting and mobility of key workers.
I hope you’ve found this quick dive into Jisc’s service provider view of eduroam activity in the UK interesting. Hopefully you’ll agree that despite the predictable overall reduction in eduroam usage, at over two million authentications a day during lockdown conditions there is still useful work happening over the trust network that Jisc operates for the UK, and that all of you helped to build.
Update: new versions of these graphs are now available.